Friday, October 22, 2010

Business Intelligence Evolution


“Evolution is not a force but a process. Not a cause but a law.”...


Business Intelligence has been transformed into considerably, a chart besides highlights major transformation points.


Business Intelligence Trends

  • BI standardization -
    While BI has been deployed departmentally, IT organizations are driving enterprise BI standards
  • BI to the masses -
    Deploying BI to the “corporate middle class” has started
  • BI meets applications and processes -
    Analytic tools, application package, and integration worlds continue to collide
  • Predictive and applied “inline” analytics -
    IT executives will put a bigger focus on predicting and integrating analytic solutions to solve business problems at the point of interaction instead of providing retrospective analysis

Business Intelligence Continuum: On the Way to Pervasive BI


“How do we get to pervasive BI?” To answer, it’s important to assess where you are along the BI continuum. Many companies are already using BI to measure and drive decisions within their organizations. During the past two or three years, many organizations have adopted CPM/EPM and leveraged the integration with their BI platforms to drive alignment between strategy and execution. The expanding role of analytics driving process optimization is being enabled by predictive analytics and data mining, in concert with traditional BI capabilities tightly coupled with business rule engines, to make the insight useful within the process context and needed process decision time frames. The future state will see BI as an augmentation of business processes — human and machine activities will be affected. In this future state, human action is enhanced, modified and even provided with implied reactive and proactive steps within the business environment by BI analysis, which is intimately participating in the continuous evaluation of even distantly related processes. The future worker, spurred by consumer behavior, social connectivity and an arsenal of personal devices, will create a work environment of infinitely varied options. Ninety percent of companies are already lagging behind the thinking and skills of the future worker. During the next five years as BI becomes integrated into applications and tools, more-diverse users (including partners and customers) will leverage the benefits of BI to lead, decide, measure, manage, innovate and optimize performance, and drive business transformation.

Major Drivers and Inhibitors to Pervasive BI

There are several significant enablers and inhibitors in achieving pervasive BI. A BI strategic plan and vision should incorporate the significant enablers. Skills development in the development and use of these technologies should begin now in preparation for future deployments. Additionally, organizations must address the inhibitors in their planning cycles, because they can significantly slow the successful adoption of BI in general.

Drivers include:

Consumerization of use of information: High expectation of ability to use and access.
Standardization/commoditization: Basic BI platform functionality (that is, reporting, query, dashboards) broadly available within the enterprise and “good enough.”
Modularization: BI functionality becomes more componentized and service-oriented. Users and developers can more easily customize. Users can add value in pursuit of self-interest.
Networked collaboration: Fosters environment of innovation and contribution. Ability to easily share and manage user insights and contributions across wide numbers of users and applications (not just internally, either).

Inhibitors include:

Skills: Lack of best practices and methodologies to manage a complex and pervasive set of BI capabilities. Users can’t understand the analysis and correctly interpret the results.
Stability and flexibility of business processes: Low process maturity. Lack of closed-loop process management.
Silo think: Of infrastructure, applications, definitions, rules, calculations and so on. “Not invented here” (NIH) syndrome.
Spreadsheet as information systems “duct tape.”
Sponsorship: Limited vision and perceived business value/impact.

Sunday, October 17, 2010

BI - EPM for Telecom

The Romans used the Latin word communicare when they meant "to make common, to share, or to impart.”.............

There is a tremendous amount of data in the telephone industry. Compared to other industries, the telecom industry simply overwhelms other industries when it comes to volumes of data. The primary factor for inflating volume of data is call level detail. Call level detail is the data regarding every phone call made – the date and time of the call, where the call was placed from, where the call went to, and how long the call was. The fact is that there are a LOT of phone calls being made, and keeping track of every one is a real challenge. Furthermore, for the most part, the phone calls exist at the lowest level of granularity. The telephone companies feel that they need the flexibility that comes with having data at the lowest level of detail. So when it comes to looking at gigantic amounts of data, telephone companies have pretty much everyone in the world beat

Telecommunication companies today operate in more and more competitive and commoditized market. The value for the enterprises lies in aggressively retaining and growing the customer base and extracting more value from each customer relationship. Business managers in the Communication industry are faced with the challenge of ever-changing market conditions. They therefore need information at their fingertips to anticipate these changes and quickly make informed decisions. Decision-making in the Communication industry today demands high-quality intelligence.

BI EPM architecture diagram shown below points out key components of Telcom solution and possible analytical solutions using it.


Telecom BI - EPM Architecture

Transactional System Layer

Call Detail Record
Keeps track of call level details and packaging, pricing, provisioning, billing, and posting or presentment of telephone services for purposes of revenue generation

Customer Acquisition
Inbound sales, new member sign-up, Cross sell / Up-sell, Retention and churn management
Customer Support and Service Fulfillment Billing queries, issue resolution and dispute management, Service provisioning (assignment, activation etc.), Order management, Credit management, Contract renewals and administration

Billing, collection
Facilitates bill generation, delivery, collection management, mode of collection

Back-office Shared Services Functions
Finance and accounting, Human Resource Outsourcing, Strategic sourcing, procurement and supply chain management, Telecom expense management, Interconnect billing.

Analytics Layer

Executive Dashboard for telecom provides real-time, accurate and Comprehensive view of the Telecom Performance. Business Plan to gain better ROI through Performance Indicators, forecasting, variance to help telecom team for better strategic Decisions making to increase the market share. Executive Dashboard provides the entire Key performance indicator which effects Telecom Management & Provide better solution for future Prediction of upcoming activities which affect Telecom Management.

Revenue Analytics gives comparative Analysis for No of SMS/calls and revenue generated by Prepaid SMS/calls and Postpaid SMS/calls for last four years. Detail level information section contains comparative analysis of International, National and local SMS/calls and revenue generated by International, National and local SMS/calls. User has extensive power of forecasting by using sliders for International, National and Local SMS/calls.

Churn rate describes the Total number of users has disconnected the service divided by the total users continuing the service for the same duration.Churn Rate Analysis contains Yearly Churn Rate comparison for last few years with alerts,Circle Wise Churn Rate status with the break up of Over-all churn and Contract Churn,Circle Wise Total Subscriber base for each year,Circle Wise Comparison for Year to date Churn values,Monthly Comparison of Churn Values for the multiple selected Circle for seasonality analysis.

ARPU is the core KPI for the Telecom industry where every manager wants to know the status of the Average Revenue per User. It is a powerful and extremely useful indicator of how well a telecom company is accessing its customers’ revenue potential. ARPU is commonly calculated in standard mathematical fashion, by dividing the aggregate amount of revenue by the total number of users who provide that revenue. ARPU is important because it provides a breakdown of what is driving revenue growth, and it also gives some indications of what is driving margins. Growing by increasing revenues from users tends to be better for margins than increasing revenues by increasing the user base, as the latter incurs additional costs. ARPU growth can also indicate how successful a company is being in moving users to new services that are regarded as strategically important. This KPI should be measured for each business as well as category of business for better classification and decision making


Some more analytics

  • Churn Analysis
  • Product Analysis
  • Network Optimization
  • Roaming Analysis
  • Customer Segmentation
  • Fraud Detection
  • ARPU/ARPM Analysis
  • Campaign Management
  • Pricing Analysis
  • Collection Analysis


Benefits
  • Reduced customer churn
  • Manage the costs of regulatory reporting
  • Expand product offerings and profitability
  • Build effective supplier and distribution channels
  • Improved customer loyalty
  • Provide customers with online use and bill analysis
  • Increased understanding of call-detail records
  • Improved effectiveness of marketing strategies
  • Improved customer service

Monday, October 4, 2010

ODI Architecture

  1. Understand ODI Architecture.
  2. Understand Components that make up ODI.
  3. Understand what are ODI repositories?

Architecture Overview:

What is Oracle Data Integrator?

  • Data integration product.
  • ODI is a development platform. (Business Rule Driven , E-LT approach)
  • Simple and faster.
  • Based on Metadata – Centralized Repository.

Oracle Data Integrator is an integration platform. Simply put, it is used to move and transform information across the information system. Oracle Data Integrator is also a development platform for integration processes. It is unique in two respects:

  • It uses an approach driven by business rules. In this approach, you focus your effort on the business side of integration, and not on the technical aspects.
  • It uses the E-LT approach. Oracle Data Integrator does not execute the integration processes itself at run time, but orchestrates a process which leverages existing systems.

Oracle Data Integrator is based on metadata. That is, descriptive information about the information system and its contents. This metadata is stored in a centralized metadata repository. These elements combined mean that, Oracle Data Integrator AIP enables “Simply Faster Integration.
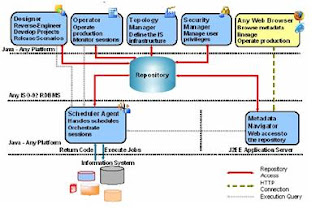

ODI Architecture


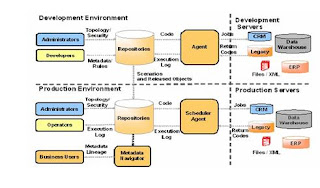
The central component of the architecture is the repository. This stores configuration information about the IT infrastructure, the metadata for all applications, projects, scenarios, and execution logs. Repositories can be installed on an OLTP relational database. The repository also contains information about the Oracle Data Integrator infrastructure, defined by the administrators.

Administrators, developers, and operators use different Oracle Data Integrator Graphical User Interfaces to access the repositories.

Security and Topology are used for administering the infrastructure, Designer is used for reverse engineering metadata and developing projects, and Operator is used for scheduling and operating run-time operations.

At design time, developers work in a repository to define metadata and business rules. The resulting processing jobs are executed by the Agent, which orchestrates the execution by leveraging existing systems. It connects to available servers and requests them to execute the code. It then stores all return codes and messages into the repository.

It also stores statistics such as the number of records processed, the elapsed time, and so on.

Several different repositories can coexist in a single IT infrastructure. In the graphic in the previous page, two repositories are represented: one for the development environment, and another one for the production environment. The developers release their projects in the form of scenarios that are sent to production.

In production, these scenarios are scheduled and executed on a Scheduler Agent which also stores all its information in the repository. Operators have access to this information and are able to monitor the integration processes in real time.

Business users, as well as developers, administrators and operators, can get Web-based read access to the repository. The Metadata Navigator application server links the Oracle Data Integrator Repository to any Web browser, such as Firefox or Internet Explorer

ODI Components


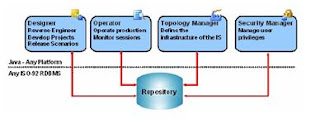
The four Oracle Data Integrator GUIs—Designer, Operator, Topology Manager, and Security Manager, are based on Java. They can be installed on any platform that supports Java Virtual Machine 1.4, including Windows, Linux, HP-UX, Solaris, pSeries, and so on.

Designer is the GUI for defining metadata, and rules for transformation and data quality. It uses these to generate scenarios for production, and is where all project development takes place. It is the core module for developers and metadata administrators. Operator is used to manage and monitor Oracle Data Integrator in production. It is designed for production operators and shows the execution logs with errors counts, the number of rows processed, execution statistics, and so on. At design time, developers use Operator for debugging purposes.

Topology Manager manages the physical and logical architecture of the infrastructure. Servers, schemas, and agents are registered here in the Oracle Data Integrator Master Repository. This module is usually used by the administrators of the infrastructure.

Security Manager manages users and their privileges in Oracle Data Integrator. It can be used to give profiles and users access rights to Oracle Data Integrator objects and features. This module is usually used by security administrators. All Oracle Data Integrator modules store their information in the centralized Oracle Data Integrator repository.

ODI Run Time Components


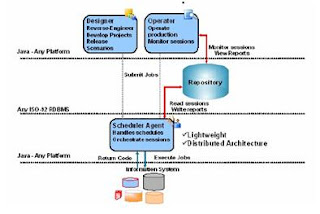
At run time, the Scheduler Agent orchestrates the execution of the developed scenarios. It can be installed on any platform provided that it supports a Java Virtual Machine 1.4 (Windows, Linux, HP-UX, Solaris, pSeries, iSeries, zSeries, and so on).

Execution may be launched from one of the graphical modules, or by using the built-in scheduler. Thanks to Oracle Data Integrator’ E-LT architecture, the Scheduler Agent rarely performs any transformation itself. Normally, it simply retrieves code from the execution repository, and requests database servers, operating systems or scripting engines to execute it. When the execution is completed, the scheduler agent updates logs in the repository, reporting error messages and execution statistics.

The execution log can be viewed from the Operator graphical module. It is important to understand that although it can act as a transformation engine, the agent is rarely used this way in practice. Agents are installed at tactical locations in the information system to orchestrate the integration processes and leverage existing systems. Agents are lightweight components in this distributed integration architecture

Metadata Navigator

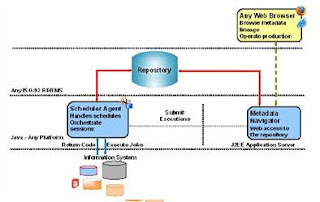
Metadata Navigator is a J2EE application that provides Web access to Oracle Data Integrator repositories. It allows the users to navigate projects, models, logs, and so on. By default, it is installed on Jakarta Tomcat Application Server.

Business users, developers, operators and administrators use their Web browser to access Metadata Navigator. Via its comprehensive Web interface, they can see flow maps, trace the source of all data and even drill down to the field level to understand the transformations that affected the data.

It is also possible to trigger and monitor processing jobs from a Web browser through Metadata Navigator


Components – A global view


By putting these pieces together, you now have a global view of the components that make up Oracle Data Integrator: the graphical components, the repository, the Scheduler Agent, and finally Metadata Navigator.

ODI Repository


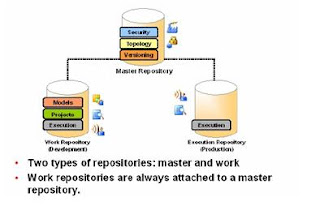
The Oracle Data Integrator Repository is composed of a master repository and several work repositories. These repositories are databases stored in relational database management systems. All objects configured, developed, or used by the Oracle Data Integrator modules are stored in one of these two types of repository. The repositories are accessed in client/server mode by the various components of the Oracle Data Integrator architecture.

There is usually only one master repository, which contains the following information:

· Security information including users, profiles, and access privileges for the Oracle Data Integrator platform.

· Topology information including technologies, definitions of servers and schemas, contexts and languages.

Old versions of objects. The information contained in the master repository is maintained with Topology Manager and Security Manager. All modules access the master repository, as they all need the topology and security information stored there.

The work repository is where projects are worked on. Several work repositories may coexist in the same Oracle Data Integrator installation. This is useful, for example, to maintain separate environments or to reflect a particular versioning life cycle.

A work repository stores information for:

· Data models, which include the descriptions of schemas, data store structures and metadata, fields and columns, data quality constraints, cross references, data lineage, and so on

· Projects, which include business rules, packages, procedures, folders, knowledge modules, variables and so on

Execution, which means scenarios, scheduling information and logs

The contents of a work repository are managed with Designer and Operator. It is also accessed by the agent at run time.

When a work repository is only used to store execution information (typically for production purposes), it is called an execution repository. Execution repositories are accessed at run time with Operator and also by agents. An important rule to remember is that all work repositories are always attached to exactly one master repository

Example of Repository Setup


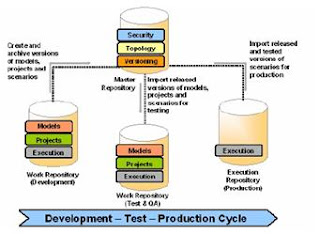
This diagram gives an overview of a typical repository architecture where development, testing and production are carried out in separate work repositories. When the development team finishes working on certain projects, it releases them into the master repository. The testing team imports these released versions for testing in a separate work repository, thus allowing the development team to continue working on the next versions. When the test team successfully validates the developed items, the production team then exports executable versions (called scenarios) into the final production work repository. This repository structure corresponds to a simple development-test-production cycle

OBIEE Architecture

The diagram beside shows the basic architecture of OBIEE and its components:

Now, first of all lets understand the flow in which a request flows from Client to Data Source.

If a client runs a report, the request first goes to the Presentation Server and then it gets routed to the BI Server and then it gets further routed to the underlying Database or the data source.

Client -> Presentation Server -> BI Server -> Data source

Now, the request is routed back through the similar route to the client. Which means, the data is fetched from the Data source and it gets routed to Presentation server through BI server and then to the client.

Client <- Presentation Server <- BI Server <- Data Source

The above flows provide a very basic idea of how the data is fetched and showed in a report in OBIEE.

Now, lets understand it more properly by dividing the above diag. into segments and then :

1) Client and User Interface

2) Presentation Server & Presentation Catalog

3) BI Server & Admin Tool

4) Datasource

Client & User Interface: This level has the UI of OBIEE which is accessible to the clients and users. The OBIEE UI has several components like OBIEE Answers, Interactive Dashboards etc.

  • Oracle BI Answers is a powerful, ad hoc query and analysis tool that works against a logical view of information from multiple data sources in a pure Web environment.
  • Oracle BI Interactive Dashboards are interactive Web pages that display personalized, role-based information to guide users to precise and effective decisions.
  • BI Delivers is an alerting engine which gives users flexibility to schedule their reports and get them delivered to their handheld devices or interactive dashboards or any other delivery profile and helps in making quick business decisions.

In simpler terms we can say that, this is a web application which is accessible to the users for preparing their reports/dashboards and do Ad-Hoc reporting to cater the business needs.

Presentation Server & Presentation Catalog:

The BI Presentation server is basically a web server on which the OBIEE web application runs. It processes the client requests and routes it to the BI Server and vice versa. It can be deployed on any of the following IIS or Oc4j. It makes use of the Presentation catalog which contains the aspects of the application.

The Presentation catalog stores the application dashboards, reports, folders and filters. It also contains information regarding the permissions of dashboards & reports created by users. It is created when the Presentation server starts and can be administered using the tool called Catalog Manager.

In other words we can say that the Presentation server and the Presentation Catalog are together responsible for providing the clients with a web server on which the web application runs and also administers the look and feel of the User Interface.

BI SERVER AND ADMIN TOOL

BI Server is a highly scalable query and analysis server. It is the heart of the entire architecture. It efficiently integrates data from multiple relational, unstructured, OLAP application sources, both Oracle and non-Oracle.

It interacts with the Presentation server over TCP/IP and takes the reporting request from the presentation server. Then the BI server processes the request and form logical and physical queries(in case of database as data source) and this physical query is sent to the underlying data source from which the data is processed. The BI Server interacts with the underlying database using ODBC. Hence, the entire processing of request is done by the BI server.

In the above paragraph I have mentioned that the BI server creates a logical and physical query. But how will the BI server generate this query?? How will the BI Server know what all joins need to be used?? I guess all these questions must be coming to your mind. So, lets understand the underlying process..

The BI server makes use of the BI Repository for converting the user request into logical and physical queries. The BI Repository is the metadata using which the server gets the information of the joins and the filters to be used in the query. It is the backbone of the architecture.

Now, this is the place where all the modelling is done and the role of OBIEE developers come into picture . The BI Repository is created using the Administration Tool. The repository contains three layers: Physical, BMM and Presentation Layer.

Physical Layer: Contains the tables imported from the underlying DB with appropriate joins between them.

BMM Layer: This is the Business Model layer and hence all the Business logics are implemented on this layer eg: Calculation of %age Sales, Revenue etc.

Presentation Layer: As the names specifies this layer is used for Presentation of required tables and columns to the users. The columns pulled in this layer are directly visible to the users